Do you use a GUI debugger? Chances are that it is backed by the GNU Debugger, gdb, somehow. Wouldn’t it be great to use that backend directly? In this article, we are going to highlight some strengths of gdb’s command-line interface over GUI frontends.
We will start by giving a quick introduction to some of gdb’s basic commands. Then we will see how to dump large areas of data memory into files, in order to analyze them later on.
Why raw gdb?
Here are some reasons why you might want to give it a try:
- You prefer using the keyboard over the mouse.
- You work on different machines remotely via ssh.
- You need to do the same debugging task over and over again.
- You want to know what’s happening under the hood.
Short Introduction
Setting up a C example is simple: Just compile your program with the -g switch and tell gdb where to find the resulting executable:
/* test.c */
int main(void) {
  int a = 42;
  a++;
  return a;
}
$ gcc -g test.c
$ gdb a.out
This will open up the gdb console. You can now start by setting a breakpoint and letting gdb execute your program. Execution will halt at the entry of the main() function and you will see the line of code that is going to be executed next:
(gdb) break main
(gdb) run
3         int a = 42;
For the sake of simplicity, I’ve omitted some of gdb’s output in the listing above.
Now let’s step to the next line and examine the a variable:
(gdb) next
(gdb) print a
$1 = 42
Gdb now tells us the current value of a. You may re-issue the commands above to check the variable’s value after incrementing.
Re-issuing commands is easy: by pressing <Enter> you can usually execute the previous one.
For now, let’s just run the program until the end:
(gdb) c
Note that c is a short form for continue. Try to find out the abbreviations for the other commands we’ve come across!
So far for an introduction. Also check out the excellent docs shipped with gdb ($ info gdb). This will show a detailed handbook for gdb. Make sure the gdb docs are installed on your system though. For Ubuntu, the name of the package is gdb-doc.
Memory dump example
Execute commands when breakpoint is hit
Let’s continue with a use case that’s (probably) hard to implement in a GUI debugger.
Assume there is a big (data) memory region in our program that should be saved to disk every time a function is called.
The following snippet shows an example where process() is called five hundred times for 1000-bytes blocks. I guess that’s motivation enough for some kind of automated debugging.
/* autotest.c */

#include <stdint.h>
#include <stdlib.h>

void process(uint8_t* p) {
  [...]
}

int main(void) {
  uint8_t* p = malloc(1000);
  for (size_t i = 0; i < 500; ++i)
    process(p);
  return 0;
}
To watch how memory content changes over time, we tell gdb to write the entire block (p through p + 1000) to out.bin upon every process() call.
For this to work, we pass the following commands to gdb after compiling and loading the executable:
(gdb) break process
(gdb) commands 1
(gdb) 	append memory out.bin p (p + blockSize)
(gdb) 	continue
(gdb) end
We use commands 1 to assign commands to the first breakpoint. The debugger will execute the append and continue commands every time that breakpoint is hit.
After running the program, you will find all 500 states of the block consecutively written to the file out.bin.
You can examine that file using standard equipment, e.g. hexdump out.bin.
There is one more thing to note here though: By default, gdb waits for user input after writing a full page of output, just like less does. To turn off this behavior, you can call gdb with the --batch option.
Now let’s use real data
In the example above, there’s nothing inside the process() function.
Let’s now put in some code that, given a block initially containing all 0xff, zeroes out the first and last byte that is not zero already.
#define BLOCK_SIZE 1001

void process(uint8_t* p) {
  for (size_t i = 0; i < BLOCK_SIZE / 2; ++i) {
    if (p[i]) {
      p[i] = 0;
      break;
    }
  }

  for (size_t i = BLOCK_SIZE; i > BLOCK_SIZE / 2; --i) {
    if (p[i]) {
      p[i] = 0;
      break;
    }
  }
}
This is great to visualize as a waterfall plot. Such a diagram arises if we:
- Interpret memory blocks as row vectors:
[x_1, x_2, ... x_1001]and - Create a matrix by concatenating them vertically.
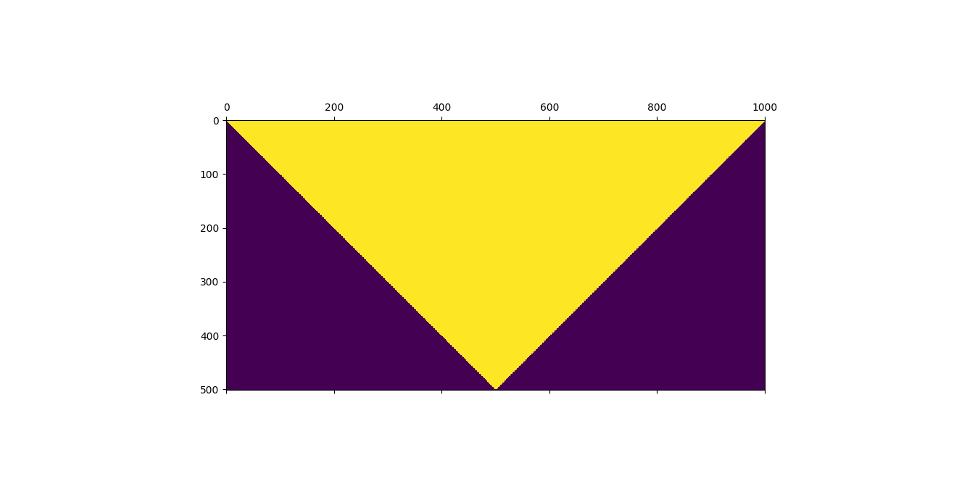 This visualization shows memory modification over time (yellow: 0xff, purple: 0x00). Isn’t that a great achievement? How much configuration would be necessary if we used a GUI frontend for generating such a diagram?
Refer to github.com/ronalterde/waterfall.git if you want to create one yourself.
This visualization shows memory modification over time (yellow: 0xff, purple: 0x00). Isn’t that a great achievement? How much configuration would be necessary if we used a GUI frontend for generating such a diagram?
Refer to github.com/ronalterde/waterfall.git if you want to create one yourself.